
The water statistic you’ve heard was retired by the people who made it.
What replaced it is smaller, stranger, and far more useful. It points at a specific basin on a specific hot day, which is something a person can actually do something about.
13 min read · Answers the third of the ten questions
Four words this argument keeps confusing.
Most of the public disagreement about AI and water is two people using the same word for different quantities. These four take five minutes and make the rest of the literature readable.
Withdrawal
Water taken out of a river, lake, or aquifer. Most of it usually goes back. A facility that withdraws a great deal and returns nearly all of it is doing something very different from one that withdraws the same amount and returns none.
Consumption
Water that does not come back: evaporated, or otherwise removed from the basin. This is the number that matters for scarcity, and it is almost never the number in the headline.
Onsite (Scope 1)
Water used at the building, mostly in cooling. It is the part people picture, and the smaller part.
Offsite generation (Scope 2)
Water used at the power plants making the electricity the facility consumes. Thermoelectric generation is water-hungry, and this is where most of the total sits. A facility can cut its onsite water to nothing and still carry a large water footprint.
Two rules follow from these, and nearly all coverage breaks both: withdrawal is not consumption, and onsite is not the whole footprint.
A bottle of water per conversation.
You have almost certainly seen it. It is the most-quoted figure in this literature, and repeating it as a fact about today costs credibility with any technical audience.
Retired by its own authors
The claim that a conversation with an AI model consumes roughly a 500 mlbottle of water every 10 to 50 responses comes from Li, Yang, Islam and Ren’s 2023 paper. It described GPT-3, in 2023, at specific facilities, and it was modeled rather than metered. It was never a statement about current models, and the researchers do not present it as one.
The replacement comes from the same paper. One GPT-3 output of 150 to 300 words consumed about 16.9 mL in an average US data center — roughly 2.2 mL onsite and 14.7 mL at the power plant. Ren notes later models are likely more efficient. Read that split again: most of the water is not in the building. It is at the generating station, which is the Scope 1 versus Scope 2 distinction doing real work.
This matters beyond the arithmetic. Every figure in this literature that drifted in retelling drifted upward and toward AI causation, while the findings that complicate the story were not exaggerated. They were ignored. That asymmetry is a finding in its own right, and it is why this guide spends as much time on where numbers came from as on what they say.
What a facility actually uses, and when.
Both of these are load-bearing, both are almost universally gotten wrong, and both travel with the figures they correct.
“A 100 MW data center uses 2 million litres a day, about 6,500 households”
This figure is the IEA’s, not Shaolei Ren’s, and it is misattributed constantly. Two problems travel with it. The household arithmetic doesn’t reconcile with US norms — 2 million litres divided by 6,500 is about 81 gallons per household per day, against a US norm nearer 300. And it assumes evaporative cooling at full nameplate load with no seasonal variation, which is exactly what the better version corrects.
Ren’s own version:a facility’s water use moves with the weather. In Arizona, a data center’s monthly use in summer can run nearly twice its average level. The seasonality is not a footnote. It is the shape of the problem.
“80% of withdrawn water is evaporated”
That figure is cooling-tower-specific, for towers with good water quality, and it is sourced to Google’s environmental report. Air cooling with evaporative assist runs nearer 70%. It is not a fleet-wide average, and using it to back-calculate withdrawals overstates them by roughly 60%.
Ren himself assumes about 50% fleet-wide. Companies report 45% (Apple) to 60% (Equinix). Note also that a different 80% floats in the same literature: the share of total water use that is offsite generation rather than onsite cooling. The two are conflated constantly, and they are not the same quantity or even the same kind of quantity.
The real constraint is the peak.
Annual totals are the unit that hides the problem. Infrastructure is not sized for a yearly average; it is sized for the worst day.
total water for one 150–300 word GPT-3 output: 2.2 mL onsite, 14.7 mL at the power plant
Li, Yang, Islam & Ren (2023/2025), modeled
an Arizona data center's monthly water use in summer against its own average. The seasonal swing, not the annual total, is what a water system has to absorb
Ren, IEEE Spectrum (2025)
million gallons per day of new peak water capacity US data centers could require through 2030. New York City's entire daily supply is about 1,000 MGD
Han, Li, Wierman & Ren (2026), preprint
Meta's Forest City, NC facility, for all of 2024. Below the state's 100,000 gallon-per-day registration threshold
WRAL (2026)
Read the third and fourth of those side by side, because together they are this guide’s whole argument. The aggregate national need is on the order of a New York City. Any given facility may be trivial. Both are true at once.
Why this is a watershed question.
Water does not move between basins. The same facility is a serious problem in southern Arizona and a rounding error in a wet basin with spare treatment capacity. Carbon is global. A ton emitted anywhere counts everywhere. Water is not, and treating it as though it were is the single most common error in this argument.
Saying so is not a way of minimizing the problem. This is the sentence that gets misheard most often, so here it is exactly. The local framing is what makes the problem addressable. A global water problem hands you guilt and nothing to do with it. A watershed problem identifies a specific municipal water system, a specific drought contingency plan, a specific withdrawal permit, and a specific disclosure requirement that either exists or doesn’t. Every one of those has a person attached to it whose job it is to answer questions. If nobody asks them, the facility gets built against conditions nobody checked.
Where the next ones are going.
If water is a watershed question, then the decision that matters most is where a facility gets built. Made once, largely at county level, and effectively permanent.
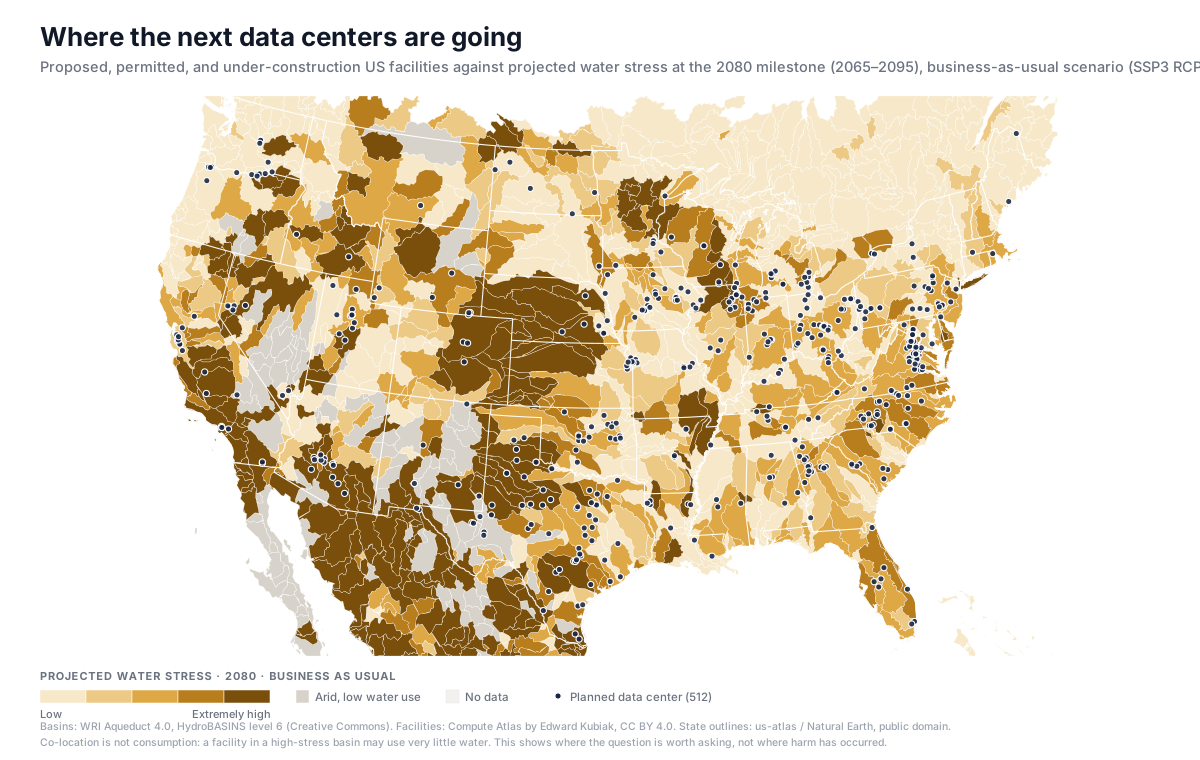
Basins, not states. Water stress is a property of a watershed, so the map is drawn in watersheds. Darker means a higher projected ratio of demand to available supply.
FigureCenter for Practical AI
DataWRI Aqueduct 4.0 (Creative Commons) · Compute Atlas by Edward Kubiak (CC BY 4.0) · us-atlas / Natural Earth (public domain)
Retrieved2026-08-20 · Aqueduct 4.0 business-as-usual (SSP3 RCP7.0), 2080 milestone (2065–2095)
ApproachVisual approach inspired by Zach Sherman
The question that has no answer until you define one word
You will often read that roughly two-thirds of data centers built or in development since 2022 are in water-stressed areas. We ran the join ourselves rather than repeat it, using the facilities on the map above and Aqueduct’s own class breaks. Of 503planned facilities that fall inside a basin with a projection, here is what “water-stressed” buys you:
30%
150 facilities, if the line is drawn at Aqueduct’s High class (40–80% of available supply already spoken for) or worse.
62%
314 facilities, if the line is drawn one class lower, at Medium-high(20%) or worse, which is roughly two-thirds.
Same facilities. Same projection. Same afternoon’s arithmetic. The only thing that moved was where somebody drew the line, and neither number is wrong. “In a water-stressed area” is not a fact about the world until someone says where the threshold is, and almost nobody quoting the two-thirds figure says. Ask which line, every time, including of us.
Planned facilities by projected basin stress class
Aqueduct 4.0 business-as-usual (SSP3 RCP7.0), 2080 milestone (2065–2095). 9 of 512 facilities fall outside any basin with a projection and are excluded.
| Projected stress class | Facilities | Share |
|---|---|---|
| Low (<10%) | 118 | 23% |
| Low–medium (10–20%) | 64 | 13% |
| Medium–high (20–40%) | 164 | 33% |
| High (40–80%) | 70 | 14% |
| Extremely high (>80%) | 80 | 16% |
| Arid, low water use | 7 | 1% |
Planned is not built, and stress is a moving target
Two cautions belong with that map, and they cut in opposite directions. The first: a dot is not a building. These are proposals, permits, and construction sites. The same source lists 44 cancelled projects, and North Carolina alone accounts for two of the largest water figures ever attached to the state, both from projects that were withdrawn or paused. Counting announcements as facilities is how a pipeline becomes a crisis on paper.
The second: co-location is not consumption. A facility inside a high-stress basin may use almost nothing. Meta’s Forest City site used about 4.2 million gallons across all of 2024, and the town manager said they were shocked at how little water it used. The map shows where the question is worth asking. It does not show harm, and anyone who presents it as a harm map is doing the thing this series exists to correct.
What the map does add is time. Every water-stress framing in circulation is present-tense, and the projection above is not: it describes the 2065–2095 window. That matters because of an asymmetry in how these decisions are made. Cooling design is chosen once, at build time, and is effectively permanent. Basin conditions are not. A siting decision evaluated only against today’s withdrawal permits is under-specified for an asset that will operate for decades, which is a scale error in time rather than in geography, and the same kind of mistake.
Two honest caveats on the projection itself. Long-horizon hydrological projections are scenario-dependent and carry wide error bars; the business-as-usual scenario shown is one of three Aqueduct publishes, and none of them is a forecast of what any particular county will experience. And Aqueduct’s future layer covers fewer basins than its baseline layer, so the gaps on the map are missing projections, not low stress. One more distinction worth keeping: this map plots announcedfacilities. A separate modeled dataset from the Department of Energy’s IM3 project projects where facilities are likely to be built through 2035 — a different question, with a different kind of uncertainty, and not interchangeable with this one.
“They're building data centers where the water isn't.”
The version that goes too far
Reads a national dot map as proof that each facility is draining its basin. It treats announcements as buildings, ignores that dozens of listed projects are cancelled, and skips the step where anyone checks what a given facility actually consumes.
The version that waves it away
Answers with “correlation isn't causation, and these are projections anyway.” Both true. Neither is a reason to site a multi-decade asset in a basin nobody looked at, on the strength of a permit that describes today.
What the evidence supports
Siting is the highest-leverage water decision anyone makes about a data center, it is made once, it is made mostly by counties, and it is largely evaluated against present conditions. Whether that matters in your basin depends on the threshold you pick and on facts your utility may not be required to publish.
Sources for this split: aqueduct40 · computeAtlas · ncWaterUse — full citations below.
The tradeoff nobody mentions.
The single most useful and least-quoted finding in this literature, and the proof that water and carbon were never one issue.
“Water use by data centres can be negatively coupled with CO2-equivalent emissions, with methods of reducing water consumption increasing carbon emissions in some cases.”
Chien, Gupta, Ren, Sriraman & Tomlinson (2026), Nature Reviews Clean Technology. The highlighted clause is routinely dropped in retelling, and it is both the mechanism and the paper’s own hedge.
Closed-loop “zero water” cooling designs cut onsite water and raise electricity demand, which raises emissions and raises the offsite generation water that most of the footprint lives in anyway. Anyone demanding both zero water and zero carbon is asking for something the engineering does not currently offer. Two impacts that can move in opposite directions were never one issue, and a policy that treats them as one will trade one for the other without noticing.
“Can data centers just stop using water?”
The version that goes too far
Treats zero-water operation as an obvious fix that operators are simply refusing to adopt, as though the only obstacle were willingness.
The version that waves it away
Treats the water-carbon tradeoff as proof that nothing can be done, and uses the existence of a hard engineering constraint as a reason not to ask for anything.
What the evidence supports
Closed-loop designs cut water and raise electricity demand, and therefore emissions. The real levers are siting (which basin, which season), cooling design (chosen at build time, effectively permanent), reclaimed water, and disclosure. Ren's own framing is local concentration, peak timing, and tradeoffs, not aggregate scarcity.
Sources for this split: waterCarbonTradeoff · itifSoluble · renSpectrum — full citations below.
The strongest argument against alarm.
A guide that only engaged the weak version of the opposing case would be doing the same thing it criticizes.
ITIF’s The Data Center Water Problem Is Soluble(July 2026) argues that this is a tractable engineering and siting problem: put facilities where water is available, use closed-loop cooling where it isn’t, and use reclaimed water where you can.
The solvable-problem framing is both more accurate and more consistent with how CPAI teaches this than an alarm framing is. Water is not a fixed global stock being drained. It is an infrastructure and siting question with known engineering answers, and treating it as an unfolding catastrophe produces exactly the paralysis that prevents anyone from using those answers.
What the argument requires, though, is worth stating plainly, because “soluble” is doing a lot of work. Every one of those solutions depends on knowing something that mostly is not published: which basin a facility sits in and what its headroom is, what the facility withdraws and consumes on its peak day, and what cooling design was chosen. Soluble in principle and unmanaged in practice are compatible states, and the United States is currently in both.
“On the national level, data centers’ water use is relatively modest.”
Shaolei Ren, whose research produced most of the numbers in this debate.
His thesis is local concentration, peak timing, and tradeoffs, not aggregate scarcity. Using his numbers as alarm bells without his conditions uses them against his own argument.
“AI is draining our water.”
The version that goes too far
Treats water as a global stock, leans on a per-query figure its authors retired, and back-calculates withdrawals using a cooling-tower constant that overstates them by about 60%.
The version that waves it away
Points at small annual totals at operating facilities and concludes there is nothing here, using precisely the unit Ren says obscures the problem, and answering a peak-day capacity question with a yearly average.
What the evidence supports
The constraint is peak withdrawal capacity in a specific basin. The aggregate national need through 2030 is on the order of a New York City. Whether it lands on you is a question about your watershed and your utility's spare capacity. In most places nobody is required to tell you.
Sources for this split: smallBottle · renSpectrum · liWater2023 · ncWaterUse · ncNoDisclosure — full citations below.
What nobody is required to tell you.
Operators do not publish facility-level water data. California — a state with both a serious water problem and a large data center population — has no comprehensive disclosure requirement and therefore cannot say how much is being consumed within its borders.
In North Carolina, every large facility is served by a municipal system, so its use folds into city totals and no facility-level figure exists at all. The 4.2 million gallon figure quoted earlier in this guide exists because a reporter asked a town manager, not because anyone is obliged to publish it.
You cannot manage, argue about, or regulate a number nobody is required to produce. Every other disagreement on this page — the threshold, the scenario, the tradeoff — is downstream of that one.
Action for every level of influence.
For yourself
- Find out which river basin or aquifer serves your county, and whether it was under drought restrictions in the last three years. Both are public records, and most people have never looked.
- Learn the difference between withdrawal and consumption. It will change how you read every article on this subject, permanently.
- Look your own basin up in WRI's Aqueduct atlas, then check whether anything is planned in it. The two questions are usually asked by different people who never talk to each other.
For a community
- Ask your municipal water system whether it can report large industrial customers separately, and what its peak-day headroom is. In many systems the honest answer is "we don't track that," which is itself the finding and worth having on the record.
- Ask what the last drought contingency plan required, and who was asked to cut back first.
- If a facility is proposed locally, ask which cooling design it will use. That choice is made once, at build time, and is effectively permanent.
For a school or classroom
- Teach the difference between a global resource and a watershed resource. It is a good unit, and it transfers well beyond AI: to agriculture, to municipal planning, to any argument where a number is true at one scale and asserted at another.
- Have students find the two thresholds problem for themselves: give them a class-break table and ask what share counts as "stressed." The answer changes with the line they draw, and they will not forget it.
For policy
- Require peak water reporting, not annual totals. Annual volume is the unit that hides the constraint; peak-day withdrawal is the one the infrastructure is actually sized against.
- Set "water capacity neutral" standards for large new loads, and coordinate water and power planning. They are currently planned by different agencies on different timetables.
- Make disclosure a condition of any tax incentive. A jurisdiction that cannot say what a facility uses cannot evaluate the deal it made.
- Require siting review against projected basin conditions, not only current withdrawal permits. A permit reflects today; a facility operates for decades.
Related
What Are We Arguing About?
The ten separate questions hiding inside “AI and the environment” — where each impact lands, and where each is actually decided. Start here.
What Are We Not Told
Water use held as a trade secret, projects code-named through approval, generators found by drone. What nobody is required to report, and the routes facts take around the gaps.
Who Gets a Say
Packed hearings, state preemption, NDAs, and $130B in blocked projects in one quarter. The constraint on participation has shifted from apathy to access.
Where this leads
Reading is one thing. Practicing it is another.
The Applied AI Certification builds practical AI fluency across all six domains — the working competence that advances toward proficiency, with structured practice, feedback, and a cohort on the same problems.
Research & further reading.
Each source carries where it was published, how its numbers were produced, and the geographic scale at which its claims hold.
Want CPAI to teach this in your community?
We deliver this material as workshops and sessions for schools, libraries, local government, and community organizations, including a version built for county-level siting decisions.